

Summary Points
- The municipal bond market found itself at the intersection of supply pressure, policy uncertainty, and shifting investor sentiment
- Credit-related news centered around Federal policy proposals with a specific focus on the proposed revisions to the Endowment Tax, along with a series of Sector Outlook Revisions by Moody’s
- As the quarter unfolded, the market navigated a steepening curve, widening credit spreads, and growing anxieties around federal deficits, inflation, and trade dynamics
Quarterly Returns and Drivers
The municipal market return for the second quarter, as measured by the Bloomberg Municipal Bond Index, was -0.12%, underperforming the U.S Fixed Income Aggregate Index—a blend of taxable fixed income bonds—which returned 1.21%. Continued record-setting new issue supply weighed on the municipal market in the quarter, driving underperformance, a similar theme seen in the first quarter. Short maturity municipals outperformed longer tenors, and many indices containing bonds with maturities of 10 years and shorter generated positive returns. For example, the Bloomberg Municipal Bond 5-year Index returned 1.35% for the quarter.i
*Bloomberg
In terms of credit quality, highly rated bonds outperformed lower-quality bonds. The Bloomberg Municipal Bond High Yield index saw a -1.14% return, as quality spreads moved wider throughout the quarter, retreating from tighter-than-average levels at the start of the period.
Industrial revenue bonds were a bright spot among sectors, posting a positive return of 0.55% for the quarter. The hospital sector lagged due to tight valuations and increased worries about Federal cuts to Medicaid.
Municipal Relative Value
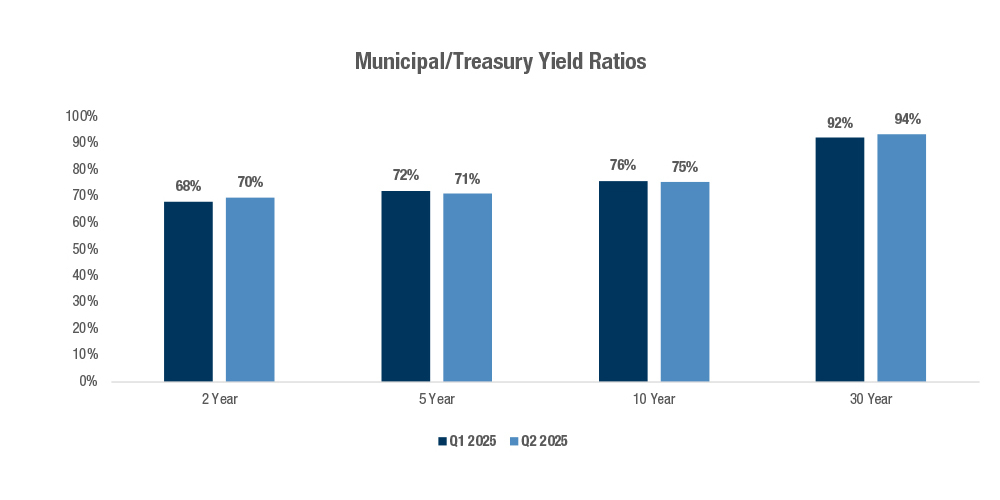
Municipal/Treasury yield ratios ended the quarter little changed, but were very volatile within the period. Following “Liberation Day” and the resulting market turmoil, municipal bond mutual funds and ETFs experienced significant outflows, the largest seen in several years. The outflows drove yields for high-quality municipal issuers higher by nearly 100 basis points in just three days, mirroring moves seen during the onset of the COVID pandemic in early 2020. The timing also coincided with tax payment season, when municipal funds have historically experienced outflows.
During these outsized moves, municipal/Treasury ratios reached as high as 88% for 10-year maturities and 102% for 30-year maturities, over four standard deviations higher than the 2-year averages, before recovering throughout the rest of the quarter.ii A higher ratio indicates increased relative value for municipal bonds. The dislocation drew interest from crossover buyers—nontraditional municipal bond investors—which helped support long-maturity municipals during this time.
While ratios declined from their highs, municipal bonds still ended the quarter at valuations that were cheaper-than-average compared to Treasuries, over the last two years, for maturities of 10 years and longer.
*Bloomberg
Liberation Day and U.S. Treasury Market Reaction
The quarter started with market participants focused squarely on the new tariff threats, while economic data garnered less attention. While U.S. Treasury yields declined in a flight to quality during the immediate days after the April 2nd tariff threat, longer maturity Treasury yields soon reversed course and began to rise notably as the yield curve steepened. Concerns about limited foreign demand for U.S. Treasuries emerged, and a narrative developed that the United States might lose its status as a haven.
The bond market volatility helped drive the Administration to pause all tariffs for 90 days, which calmed the Treasury market and other asset classes. In hindsight, the concerns regarding foreign demand may have been overblown, as U.S. Treasury data showed no meaningful decline in foreign ownership of U.S. Treasuries through April.iii
Economic Landscape
Economic data remained resilient for the quarter, although a dichotomy persisted between “soft” and “hard” data. Soft data, generally gathered from surveys on consumers’ outlooks for the economy, underwhelmed. For example, the Conference Board Consumer Confidence data continued to trend lower than average compared to previous years. Recent readings, shown in April and June at 85.7 and 93.0, respectively, were the two lowest since January 2021.
However, employment growth continued at a solid, albeit slowing, pace, with the widely watched non-farm payroll figures beating expectations and recording robust job additions of 158,000 and 139,000 in April and May, respectively (latest figures available as of June 30th).
In June, the 3rd revision for Q1 2025 GDP showed a -0.5% contraction. However, when analyzing the components, the net exports segment was an outlier that dragged down the overall GDP figure, as importers likely stocked goods at a rapid pace, attempting to increase inventories ahead of expected tariffs.
For further perspective, the Atlanta Fed’s GDPNow, which provides a GDP estimate for the current quarter (Q2), projected a 2.9% figure at quarter-end as the net exports component likely normalized.iv
Later in the quarter, as the financial details of the reconciliation bill surfaced, concerns about the deficit mounted, and the long end of the U.S. Treasury curve came under pressure once again.
In mid-May, Moody’s downgraded the U.S. credit rating to Aa1 from AAA, citing continued and widening deficits as one of the key drivers. The downgrade itself had a limited impact on the markets.
The Federal Reserve (FOMC)
With no meaningful signs of a weakening economy and mounting concerns about inflationary pressures due to tariffs, the FOMC held interest rates steady during the quarter.
Reflecting the Federal Reserve Board’s vigilance surrounding inflation, the Board updated its inflation forecast at the June meeting, moving the Core PCE estimate up to 3.1% for December 2025, up from the 2.8% estimate given at the March meeting.
Looking at market expectations for the FOMC, in the first part of the quarter, the Federal Funds futures market priced in a chance of either three or four 25-basis-point rate cuts by year-end. However, by the end of the quarter, markets had fully priced in only two 25-basis-point cuts by year-end, as economic data generally remained resilient, and optimism grew that the U.S. would reach trade deals with its major trading partners.
Municipal Market – A Story of Overwhelming Supply and a Steepening Yield Curve
2025 is shaping up to be another record year of municipal new issue supply, on track to top last year’s record of $527B.v Year-to-date issuance is up approximately 14% compared to 2024.
Several primary factors contributed to the elevated supply, including higher inflation over the last several years, which has increased project costs. Pent-up issuance needs also contributed to the heavy issuance; 2022 and 2023 were unusually light supply years as issuers’ balance sheets were bolstered from COVID-era stimulus packages, and some municipalities were able to avoid bringing new bonds to market during a period of rapidly rising interest rates. Lastly, some issuers likely expedited new issue deals in light of the new Presidential Administration, attempting to price tax-exempt deals ahead of any potential changes to the municipal bond tax- exemption.
It is noteworthy that the final reconciliation bill, expected to be passed into law by July 4th, did not include any changes to the municipal bond tax-exemption, which was the widely expected outcome.
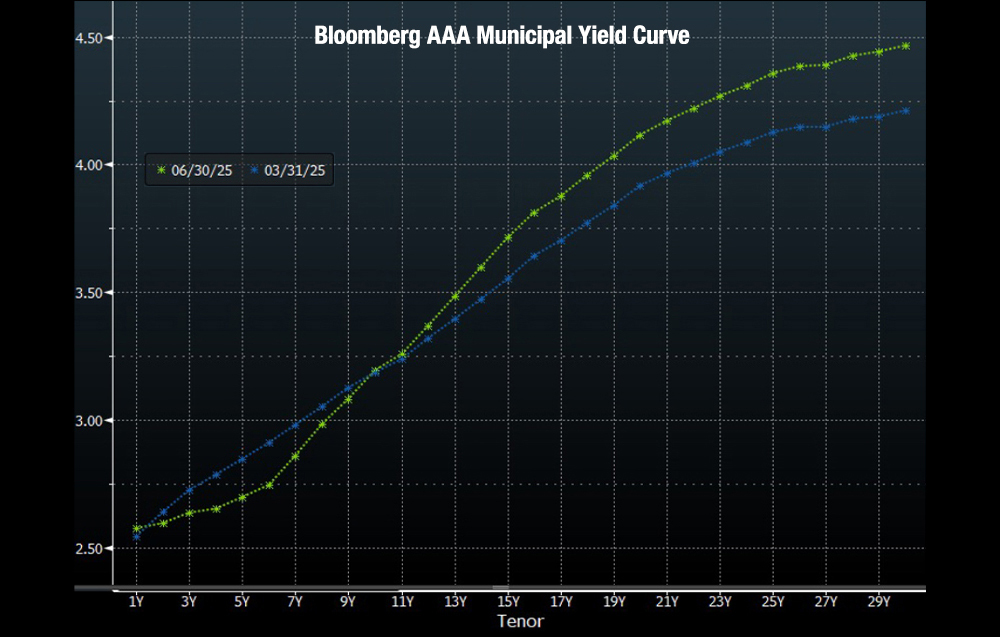
Municipal Yield Curve Steepening
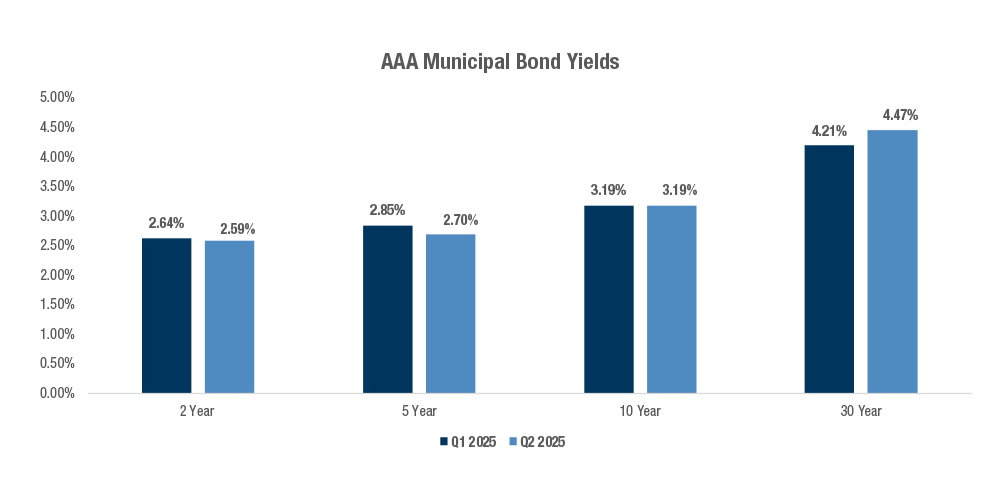
The municipal bond yield curve continued to steepen in the quarter, as 5-year AAA rates declined in yield by 15 basis points, while 30-year AAA yields rose by 26 basis points. Mutual fund demand has been tepid so far this year, which helped to drive the steepening as this group is a significant source of support for the long maturity segment. At the same time, general concerns about long-term bonds in the U.S. Treasury market due to fiscal deficits likely played a role, with some investors proceeding with caution when it came to longer-duration securities.
At the end of the quarter, 30-year municipal bonds yielded a notable 177 basis points more than 5-year bonds, the widest spread since 2015.vii
*Bloomberg
Credit Commentary
House Ways and Means Committee – Endowment Tax (has subsequently been revised to a less credit consequential version pursuant to the passage of The One Big Beautiful Bill)viii
Below is a summary of specific proposals from the House Ways and Means Committee budget reconciliation draft that could impact the Private Higher Education sector (Private Higher Education Endowment Tax):
Proposed Modifications
The tax rate would vary depending on the institution’s student-adjusted endowment:
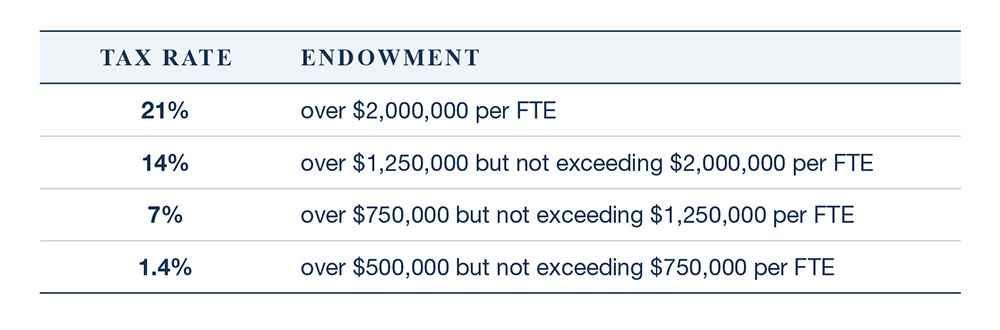
An applicable educational institution is defined as an eligible institution with at least 500 tuition-paying students, more than 50% of whom are in the U.S., and with a student-adjusted endowment of at least $500K. State colleges, universities, and qualified religious institutions are excluded. The amendment would take effect for taxable years beginning after December 31, 2025.
Background: Starting in 2018, certain private colleges and universities with endowments valued at $500K or more became subject to a 1.4% excise tax on total net investment income. For this tax, net investment income is classified as capital gains as well as other sources of investment income (e.g., interest and dividends), less expenses associated with earning that income.ix Generally, universities’ endowment fund investment returns are exempt from federal income tax; however, the Tax Cuts and Jobs Act (TCJA) imposed a 1.4% tax on the net investment income of certain college and university endowments levied annually.
Qualifications (current form)
- A private college or university that has: (i) at least 500 tuition-paying students in the preceding tax year, (ii) more than 50% of those students located in the United States, and (iii) an aggregate fair-market value of assets (other than those assets which are used directly in carrying out the institution’s exempt purpose) that was at least $500K per student at the end of the preceding tax year.
According to IRS data, in 2023, 56 institutions satisfied the criteria, generating $381M in revenue.x The IRS does not disclose which institutions pay the endowment tax each year, but universities themselves confirm if they are subject annually in their Form 990 PF. Universities that are subject generally do not disclose the amount of the actual tax payment they make in their financials, nor in other public filings.
Moody’s Sector Outlook Revisions
- Non-Profit Organizations (05/08): Moved to negative from stable as federal policy changes and more cautious consumers are creating revenue uncertainty. Ongoing investment volatility continues to threaten liquidity, balance sheet strength, and fundraising prospects. The potential impact of increased tariffs also increases risks related to interest rates, capital spending, and the pace of economic growth.xi
- U.S. Airports (05/05): Moved to negative from stable to reflect weakening economy and lower capacity growth. Enplanements are expected to decline modestly in 2025 compared to last year due to a deceleration in economic growth. Moody’s predicts U.S. real GDP growth will slow to 1% in 2025, down from their 2% projection in February. Consumer confidence has also waned.xii
- U.S. Ports (04/24): Moved to negative from stable as tariffs and policy uncertainty will dent trade volumes. Tariffs on Chinese goods will have the most pronounced adverse effect on volumes. Sustained high tariffs, especially on China, could harm ports’ relatively strong credit quality, which is driven by a multi-year period of healthy financial performance and robust liquidity. Given that demand for container cargo has historically been correlated with growth in U.S. real GDP and retail sales, Moody’s expects slowing economic activity stemming from policy uncertainty to weaken U.S. trade volumes further.xiii
ii Bloomberg
iii U.S. Treasury Major Foreign Holders of Treasury Securities. Latest as of 6/30/25.
https://ticdata.treasury.gov/resource-center/data-chart-center/tic/Documents/slt_table5.html
iv Atlanta GDP information can be found here:
https://www.atlantafed.org/-/media/documents/cqer/researchcq/gdpnow/RealGDPTrackingSlides.pdf
v See End Note ii
vi See End Note ii
vii See End Note ii
viii Ropes & Gray Senate Tax Package Includes Major Changes to Endowment and Executive Compensation Excise Taxes (July 2, 2025)
https://www.ropesgray.com/en/insights/alerts/2025/07/senate-tax-package-includes-major-changes-to-endowment-and-executive-compensation-excise-taxes
ix Congressional Research Service College and University Endowments: Payout Rates and Spending on Student Financial Aid (March 22, 2023)
https://www.congress.gov/crs-product/IN12126?q=%7B%22search%22%3A%22IN12126%22%7D&s=1&r=1
x IRS Publication 6038 Excise Taxes, Calendar Year 2023 (November 2024)
https://www.irs.gov/pub/irs-pdf/p6038.pdf
xi Moody’s Not-for-Profit Organizations – US Outlook update – Shifts to negative on federal policy changes, cautious consumers (May 8, 2025)
https://www.moodys.com/research/Not-for-Profit-Organizations-US-Outlook-update-Shifts-to-negative-on-Outlook–PBC_1447009#290612199861c31d1036b185b4e69b75
xii Moody’s Airports – US Outlook update – Negative with weakening economy and lower capacity growth (May 5, 2025)
https://www.moodys.com/research/Airports-US-Outlook-update-Negative-with-weakening-economy-and-Outlook–PBC_1445257
xiii Moody’s Ports – US Outlook update – Shifts to negative as tariff effects loom (April 24, 2025)
https://www.moodys.com/research/Ports-US-Outlook-update-Shifts-to-negative-as-tariff-Outlook–PBC_1445256
Disclosure
A&M Private Wealth Partners, LLC (“AMPWP”) is an SEC-registered investment adviser. SEC registration does not imply a certain level of skill or training. For additional information on the services AMPWP provides, as well as our fees for such services, please review our Form ADV at adviserinfo.sec.gov, contact us at 300 Banyan Boulevard, 10th Floor, West Palm Beach, FL 33401, or call us at (561) 268-0900.
This piece and its content reflect AMPWP’s views at the time of its writing, and the information presented and AMPWP’s views are for informational purposes only. Such views are subject to change at any time without notice including due to changes in market or economic conditions, and forward-looking statements or forecasts are based on assumptions and may not be realized. Future events and outcomes are inherently uncertain. Statements are subject to risks and uncertainties that could cause actual outcomes to differ. AMPWP has obtained information provided herein from various third-party sources believed to be reliable, however, such information is not guaranteed and is subject to errors, omissions, and changes. No reliance should be placed on the views and information presented when making any investment or liquidation decision. AMPWP is not responsible for the consequences of any decisions or actions taken or not taken as a result of the views and information presented, and AMPWP does not warrant or guarantee the accuracy or completeness of this piece or information presented.
Additional content may be relevant for further context or other insight. Portfolios should also be viewed in the context of the broad market and general economic conditions prevailing during the periods covered by performance and other information. Any references to future returns and/or risk are not promises of the actual return a portfolio may achieve nor do they reflect all risks. Not all investments are suitable for all investors. All investments involve risk of loss, including to principal, and all investors must be prepared to bear such loss. Different securities, strategies, and allocations have different costs and risks, and diversification also does not assure a profit nor protect against a loss. Past performance is not a guarantee of future results. Additionally, changes in investment strategies, contributions, or withdrawals may materially alter results, as may market conditions, other factors including but limited to economic factors, fees, expenses, and events. Nothing herein should be construed as an investment recommendation. AMPWP does not provide legal, accounting, or tax advice, and AMPWP’s services are not intended to act as a substitute for such advice. AMPWP encourages you to seek the counsel of a qualified attorney and/or accountant for legal, accounting, or tax advice.