

- Municipal bonds outperform in Q3: Bloomberg Muni Index 3.00% vs. U.S. Agg 2.03%.
- September did the heavy lifting as fund inflows rose on increased expectations of a Fed cut; long maturities led.
- High yield municipals lagged again; Bloomberg Muni HY 1.63%.
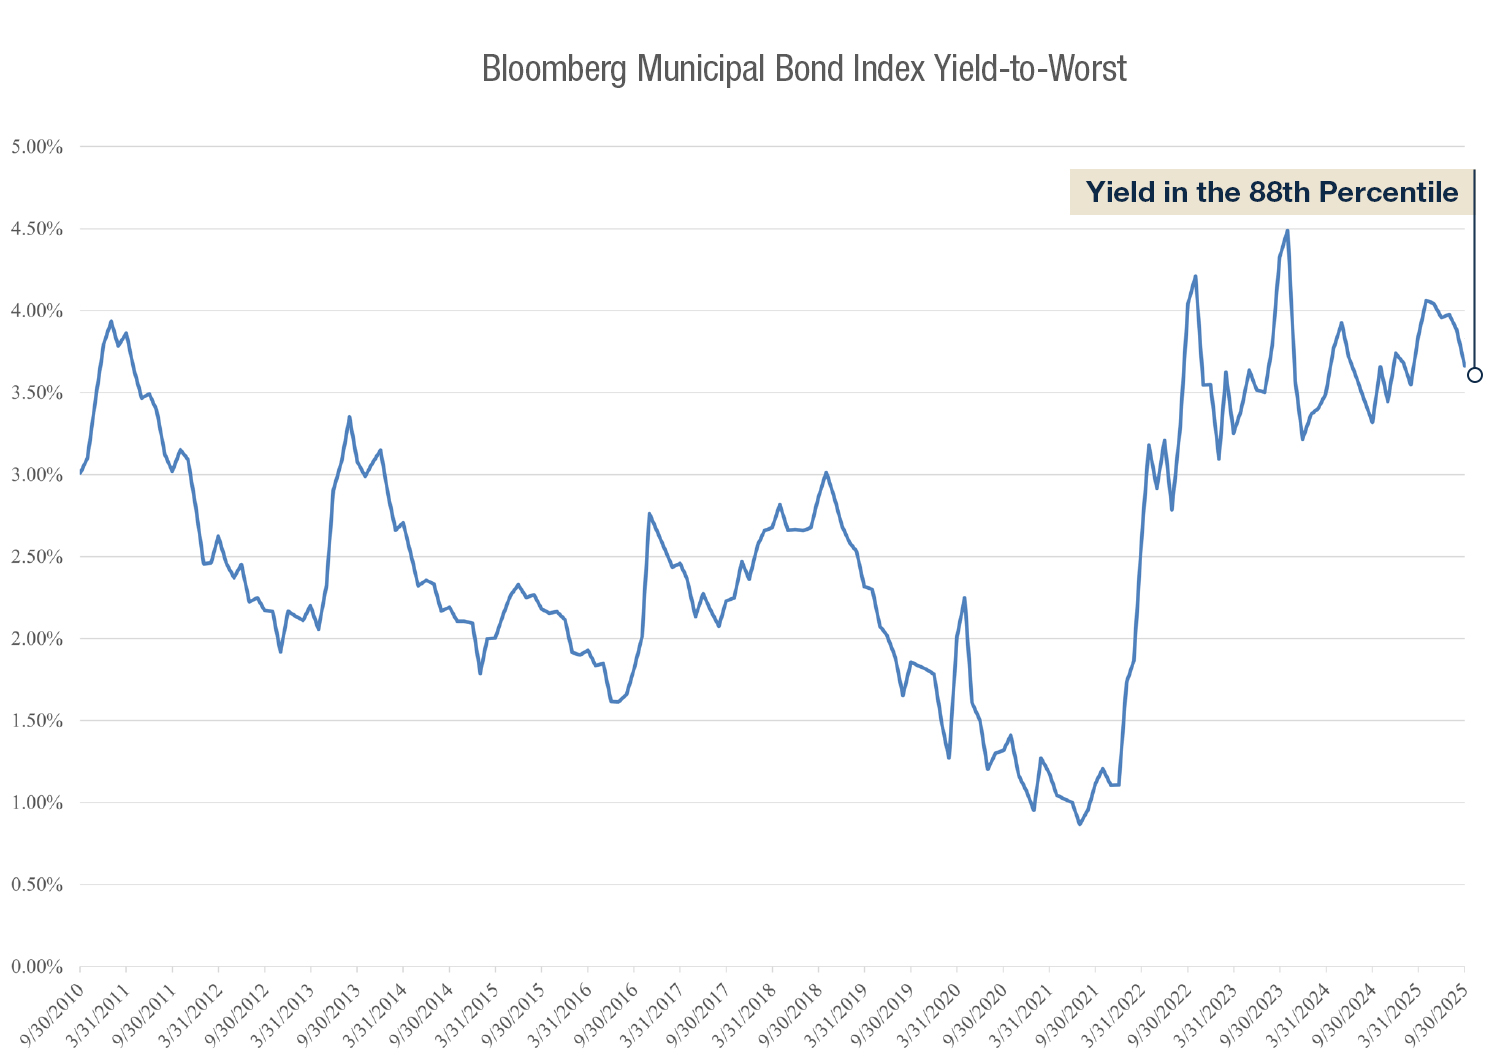
- Income still compelling: Index yield-to-worst ended Q3 in the 88th percentile of the past 15 years.
- Fed cut 25 bp in September to 4.00–4.25; markets see at least one more cut in 2025.
- Macro: Q2 GDP 3.8% rebound, inflation above target, and hiring cooled sharply.
- Credit: hospital policy risks from OBBBA; upgrades for Connecticut, MTA, and New Jersey; and Moody’s updated municipal bond default recovery rates.
Quarterly Returns and Drivers
After underperforming the broader fixed income markets in the first half of the year due to record new issue supply, municipal bonds found firmer footing in the 3rd quarter. The municipal bond market, as measured by the Bloomberg Municipal Bond Index, returned 3.00% for the period. This outperformed the Bloomberg U.S Fixed Income Aggregate Index—a blend of taxable fixed income bonds—which returned 2.03%.
The municipal bond market’s outperformance was primarily concentrated in September, as renewed investor demand surfaced, and net inflows to municipal bond funds increased significantly. We believe the prospect of several upcoming rate cuts from the Federal Reserve was a major driver behind the resurgence of demand.
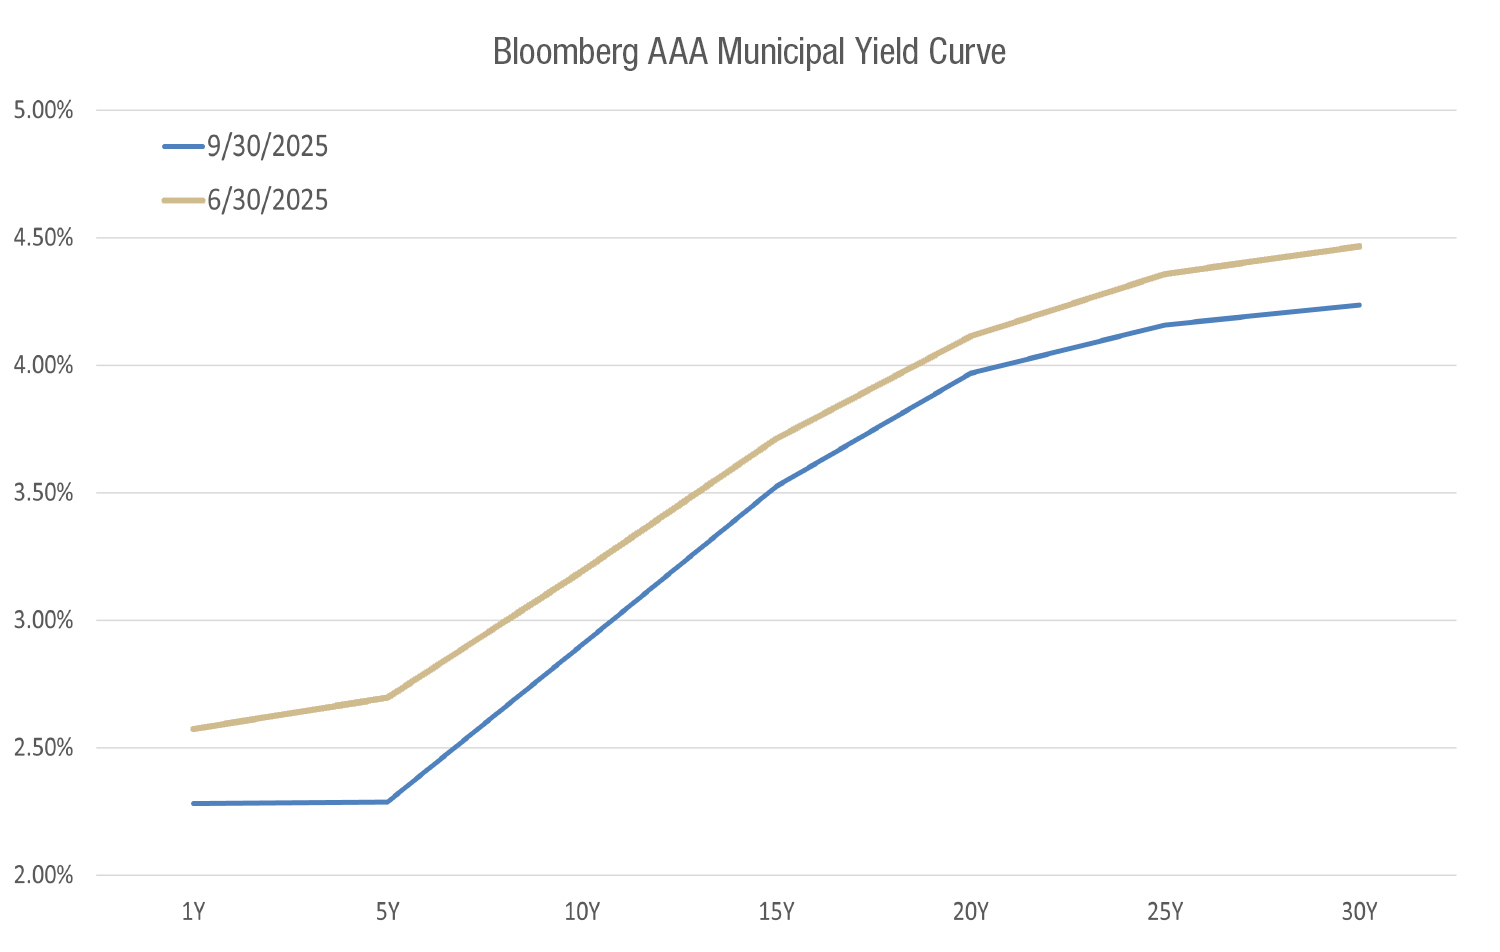
In contrast to Q1 and Q2, we saw that long-maturity municipals outperformed the broader municipal market in Q3, with the Bloomberg Long Bond Index returning 3.82%. The municipal yield curve began to flatten in September, retreating from historically steep levelsi, which helped to drive the long-end returns.
High-yield municipals lagged for a second quarter in a row, with the Bloomberg Municipal High-Yield index returning 1.63%.
*Bloomberg
Even with municipal yields declining over the period, the yield-to-worst of the Municipal Bond Index ended the quarter in the 88th percentile over a 15-year period.
Economic Landscape
The latest GDP data from September showed that the U.S. economy rebounded in the 2nd quarter, with GDP growing at an annualized rate of 3.8%. The strong growth figure reversed the contraction of -0.5% in the first quarter, when importers increased inventories ahead of expected tariffs, creating a drag on the net exports component of GDP. We see the strong rebound in the economy as mainly driven by the resilient U.S. consumer. Personal spending and personal income readings both rose throughout the 3rd quarter, with the August reading for personal spending up 0.6% and personal income up 0.4%. In August, retail sales increased 0.6%. This was the third straight month of positive retail sales.
Inflation remained persistent and higher than the U.S. Federal Reserve’s target of 2%. Core PCE rose throughout the quarter from the April low of 2.6%, culminating with a core PCE of 2.9% for August. The Core CPI, less food and energy, remained elevated with the August reading at 3.1%, while PPI ex-food and energy came in at 2.8%.
The U.S. job market data garnered much of the attention in the quarter, as employment trends are seen as a key factor in future Fed policy. Nonfarm payroll growth for July showed a significant slowing in hiring, with the 3-month average change at only 35,000, the lowest figure since 2020, and before that, 2010. Significant downward revisions in the July report indicated job growth was much less than initially reported in preceding months. The weak trend continued in the August employment data, which showed a 3-month average change in nonfarm payrolls of only 29,000. For comparison, the 3-month average change in January 2025 was 232,000.
The weakening labor market reports heightened investors’ expectations for an interest rate cut at the September FOMC meeting, with U.S. Treasury yields moving lower in advance of the announcement.
Following the significant downward revisions to the July data, the Administration fired the head of the Bureau of Labor Statistics (BLS). While the move created some concern as reported by the financial media, we did not observe major market movements.
The Federal Reserve – Delivering on a 25 Basis Point Cut in September
The Fed cut interest rates by 25 basis points at the September meeting, as widely expected, bringing the policy rate down to the 4.00 to 4.25% range. With two meetings left in 2025, futures markets priced in a further rate reduction of at least another 25 basis points by year-end, with the potential of a 50-basis point cut.
It is worth noting that Federal Reserve Governor Adriana Kugler resigned in August, several months before her term was set to end in January 2026. The Administration appointed Stephen Miran, head of the Council of Economic Advisers within the Executive Office, to replace Kugler on an interim basis through January 2026.
Lisa Cook, another Federal Reserve Governor, received accusations from the Administration of mortgage fraud during the quarter. Cook was able to vote at the September meeting, but multiple lawsuits are pending.
While both moves created buzz among market participants regarding the Fed’s independence, we did not see an immediate impact on markets.
Municipal Market – A Slow Start, but a September to Remember
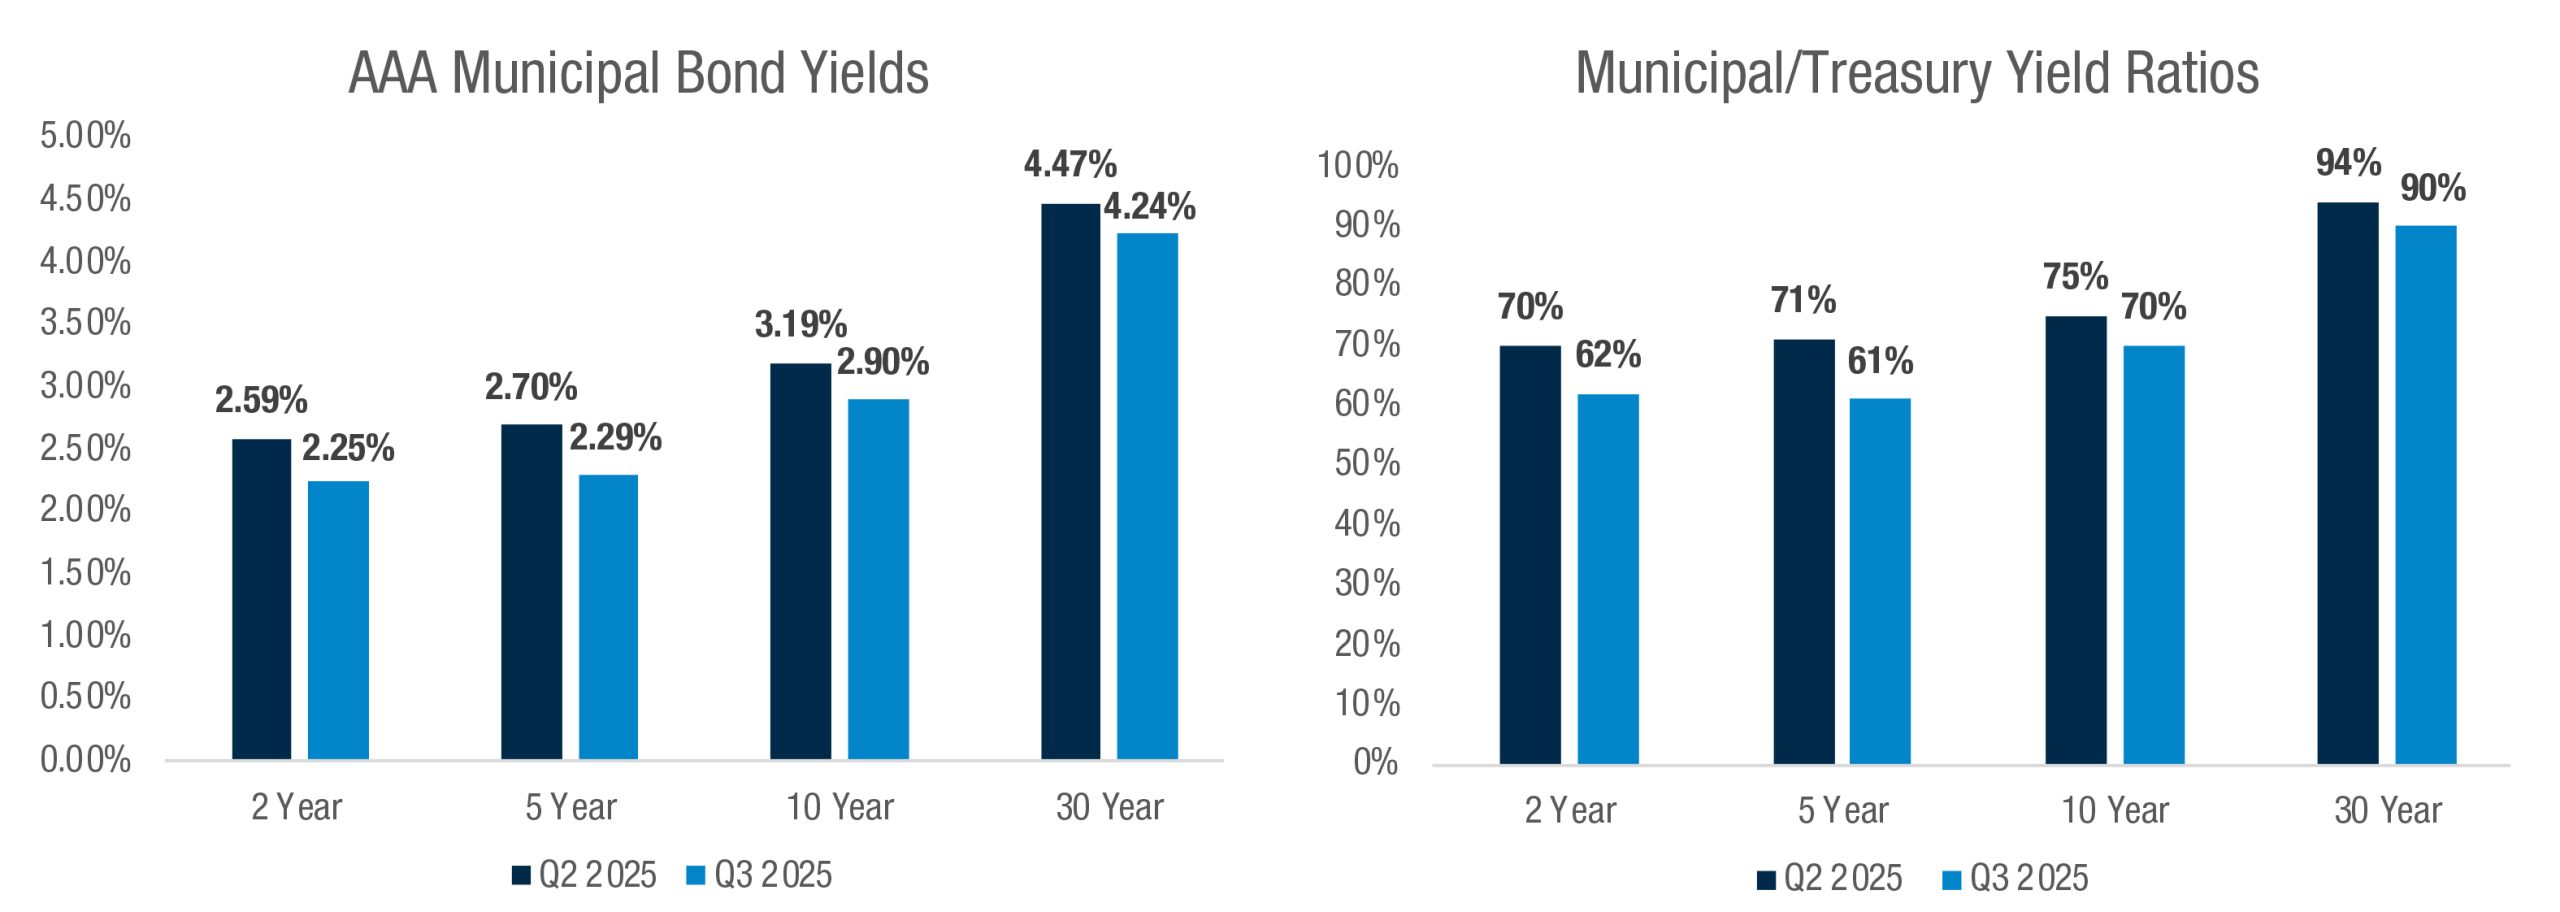
In our analysis, municipal bonds appeared attractive at the start of the quarter, particularly the long-maturity segment of the market. The Bloomberg Municipal Long Bond Index yielded 4.90%, equating to a taxable-equivalent yield of over 8% for investors in the top federal tax bracketii. Relative value versus U.S. Treasuries looked compelling to us as well, with 30-year AAA municipals yielding 95% of 30-year Treasury Bonds—notably above the average yield ratio of 87% over the last two yearsiii. A higher ratio indicates increased relative value in tax-exempt municipal bonds.
However, the municipal market kicked off the quarter in a similar fashion to Q2, with underwhelming returns compared to other taxable fixed income asset classesiv. Continued record new issue supply weighed on the market, as $59B in deals were priced in July, the highest total for any July based on available data since 2002v. At the same time, worries about rising long-term bond yields in the U.S. and abroad continued to affect investors’ sentiment. Municipals with 7-year maturities and shorter rallied in July, but longer maturities continued to produce negative returns.
The turning point for the municipal market came at the very beginning of September when the monthly employment data reflected a second consecutive reading of very weak job growth. Substantial net inflows to municipal bond funds followed as the market increased expectations for both a rate cut at the September FOMC meeting and additional cuts by the end of 2025. The new demand in the market sparked a surge in prices. The Municipal Bond Index returned 2.32% for the month, outperforming the broader U.S. Aggregate index by 1.09%. The municipal yield curve flattened as investors began to take advantage of the attractive steepness and relative value, and became more comfortable adding duration to portfolios.
Credit Commentary
AMPWP Summary:
Credit-related news centered around the passage of the One Big Beautiful Bill Act (OBBBA) and the potential impact on hospitals, select credit upgrades, the fiscal health of states, and Moody’s updated municipal bond default and recovery rates study.
One Big Beautiful Bill Act (OBBBA) & The United States Not-for-Profit Hospital Sector
On July 4th, President Trump signed the One Big Beautiful Bill Act (OBBBA) into law. OBBBA introduces policy changes that could reshape financial performance and challenge investors’ assumptions within the U.S. not-for-profit hospital sector. At the center of OBBBA are provisions aimed at reducing Medicaid spending. These measures include stricter eligibility recertifications, new work requirements, and caps on provider taxes and state-directed payments. The legislation also restricts Affordable Care Act marketplace eligibility and permits ACA premium tax credits to expire at the end of 2025. These changes are likely to result in higher premiums and may lead some households to drop their coverage.
The United States not-for-profit hospital sector has spent much of the post-COVID period navigating a fragile rebound. According to Moody’s recent Medians report, fiscal 2024 marked a year of improvementvi. Revenues rose faster than still elevated expenses, supported by recovering patient volumes. Yet we believe the relief has been tempered to a certain extent by structural shifts that potentially lie ahead. The Congressional Budget Office estimates that OBBBA will reduce federal Medicaid spending by $911 billion over ten years and increase the number of uninsured individuals by 10 million. In rural areas, federal Medicaid support is projected to decline by $137 billion, compared with $50 billion appropriated for the rural health fund. The bulk of these changes is scheduled to begin in 2027.
Select Credit Upgrades
State of Connecticut
On September 9th, Moody’s upgraded Connecticut’s General Obligation bond rating to Aa2 from Aa3. According to Moody’s, the upgrade was driven by the state’s well-established strong governance practices, which have led to increased budgetary reserves and consistent pension contributions that have begun moderating the state’s very high unfunded pension liabilities. With continued adherence to these policies, the state is expected to maintain solid reserve levels and further reduce leverage metricsvii.
New York Metropolitan Transit Agency (MTA)
On August 12th, Standard & Poor’s (S&P) upgraded its underlying rating to A from A- for the MTA’s Farebox revenue bonds. S&P based the upgrade on several factors, including New York State’s decision to increase the payroll mobility tax for MTA’s capital programs, the initial financial success of MTA’s Manhattan congestion pricing program, ongoing recovery in ridership levels, maintenance of healthy liquidity levels, clarity regarding funding sources of the recently approved 2025-2029 capital program, and manageable projected out-year deficitsviii..
State of New Jersey
On August 11th, Standard & Poor’s (S&P) upgraded New Jersey’s General Obligation bond rating one notch to A+ from A due to a material improvement in the state’s balance sheet reflecting management’s commitment to rein in its comparatively large debt and pension liabilities while striving to achieve a structural budget balance in the long term. S&P believes the state has transitioned to an operating environment that is more predictable and stable, strengthening management’s ability to address budgetary challenges as they ariseix.
National Association of State Budget Officers’ Fiscal Health of States – Spring 2025x
According to the National Association of State Budget Officers (NASBO), a majority of states met or surpassed their revenue targets for FY25. In general, states have conservatively budgeted for FY26 to decelerate general fund spending growth while either adding to or maintaining their rainy-day funds.
NASBO’s Summary:
General Fund Spending
- Governors’ budgets for fiscal 2026 call for general fund spending 0.8% above estimated levels for fiscal 2025.
- 24 states are projecting lower general fund spending in recommended budgets for fiscal 2026 compared to fiscal 2025 levels; the median annual growth rate is 0.0%.
General Fund Revenue
- Revenue projections for fiscal 2026 used in governors’ budgets are 2.8% higher than current estimates for fiscal 2025, which would mark a fourth consecutive year of modest revenue growth.
- In fiscal 2025, 34 states reported receipts were exceeding original estimates at the time of data collection, while nine states reported revenues were on target, and seven states reported coming in below estimates.
- Governors’ budgets for fiscal 2026 propose a mix of tax policy changes, with 14 states recommending net increases and 20 states recommending net decreases.
State Balances
- Most states are projected to maintain or increase the size of their rainy-day fund balances in dollars in fiscal 2025 and fiscal 2026. However, the estimated median balance as a percentage of expenditures decreased in fiscal 2025 due to general fund spending increasing at a faster rate than reserves that year.
Total balances, meanwhile, are expected to continue declining in fiscal 2025 and fiscal 2026 as states spend down prior-year unanticipated surpluses that have accumulated in their general fund ending balances. States spending down a portion of their large balances is to be expected and in line with routine budget practice, with many states directing these surplus funds to one-time investments.
Moody’s U.S. Municipal Bond Default and Recovery Rates, 1970 – 2024xi
On August 4th, Moody’s updated their findings concerning the default, loss and rating transition experience of Moody’s-rated U.S. municipal bond issuers in 2024 and since 1970.
Moody’s key findings:
- There was one default in 2024 and most of the municipal sector remained highly rated and stable. A small hospital system’s severe cash flow and liquidity challenges led to missed rental payments and ultimately the acceleration of the debt which it was unable to pay.
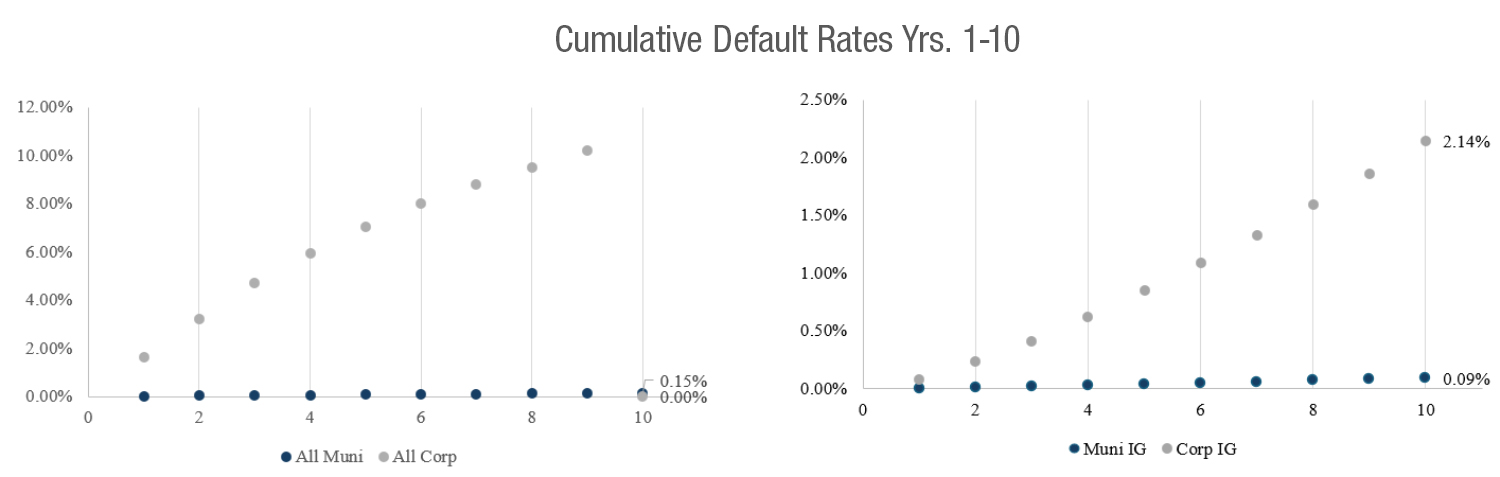
- Municipal defaults remain rare and concentrated in competitive enterprises. The average five-year cumulative default rate (CDR) has been stable or fallen for the municipal sector overall and for each subsector over the past five years. The average five-year CDR since 2015 for the municipal sector overall is 0.05%, broadly consistent with the entire study since 1970. The competitive enterprises subset of the municipal sector has the highest five-year CDR, at 0.20% since 2015 and 0.35% for the entire study. However, this is still very low compared with the average five-year global corporate CDRs of 8.3% since 2015 and 7.1% since 1970.
- Municipal ratings continued to drift up and at a higher rate than corporates. In 2024, the one-year rating drift was 4.2 notches per 100 credits for municipals as upgrades again outpaced downgrades, higher than the rating drift for global corporates of 1.1 notches per 100 credits. General governments and municipal utilities led the way for the municipal sector as rating drift remained negative for competitive enterprises in 2024.
- Municipal ratings have successfully differentiated defaulters from non-defaulters. Since mid-2020, the three-year average defaulter position for municipals has exceeded 99%, while the corporate three-year average defaulter position has ranged between 82% and 84%.
- Municipal credits remain highly rated. The divergence in default rates underpins the predominantly higher ratings of the municipal sector, reflecting its greater resilience. The median rating for municipal issuers is Aa3, compared with Baa3 for global corporates. As of the end of 2024, 98.5% of the municipal sector was rated investment grade compared to only 54.7% of corporates.
(Sourcexii)
Disclosure
A&M Private Wealth Partners, LLC (“AMPWP”) is an SEC-registered investment adviser. SEC registration does not imply a certain level of skill or training. For additional information on the services AMPWP provides, as well as our fees for such services, please review our Form ADV at adviserinfo.sec.gov, contact us at 300 Banyan Boulevard, 10th Floor, West Palm Beach, FL 33401, or call us at (561) 268-0900.
This piece and its content reflect AMPWP’s views at the time of its writing, and the information presented and AMPWP’s views are for informational purposes only. Such views are subject to change at any time without notice including due to changes in market or economic conditions, and forward-looking statements or forecasts are based on assumptions and may not be realized. Future events and outcomes are inherently uncertain. Statements are subject to risks and uncertainties that could cause actual outcomes to differ. AMPWP has obtained information provided herein from various third-party sources believed to be reliable, however, such information is not guaranteed and is subject to errors, omissions, and changes. No reliance should be placed on the views and information presented when making any investment or liquidation decision. AMPWP is not responsible for the consequences of any decisions or actions taken or not taken as a result of the views and information presented, and AMPWP does not warrant or guarantee the accuracy or completeness of this piece or information presented.
Additional content may be relevant for further context or other insight. Portfolios should also be viewed in the context of the broad market and general economic conditions prevailing during the periods covered by performance and other information. Any references to future returns and/or risk are not promises of the actual return a portfolio may achieve nor do they reflect all risks. Not all investments are suitable for all investors. All investments involve risk of loss, including to principal, and all investors must be prepared to bear such loss. Different securities, strategies, and allocations have different costs and risks, and diversification also does not assure a profit nor protect against a loss. Past performance is not a guarantee of future results. Additionally, changes in investment strategies, contributions, or withdrawals may materially alter results, as may market conditions, other factors including but limited to economic factors, fees, expenses, and events. Nothing herein should be construed as an investment recommendation. AMPWP does not provide legal, accounting, or tax advice, and AMPWP’s services are not intended to act as a substitute for such advice. AMPWP encourages you to seek the counsel of a qualified attorney and/or accountant for legal, accounting, or tax advice.
ii Using 40.8% top tax rate at federal level (37% tax bracket + 3.8% net investment income tax)
iii Bloomberg
iv Bloomberg. Municipal bond index return 6/30 – 8/31 .67% vs U.S. Agg at .93%
v Bloomberg municipal supply data. Data set goes back to 2002; July 2025 supply may have been a record for an even longer period.
vi https://www.moodys.com/research/doc–PBC_1455260
vii https://www.moodys.com/research/Moodys-Ratings-upgrades-State-of-Connecticut-to-Aa2-and-assigns-Rating-Action–PR_909328872
viii https://www.capitaliq.spglobal.com/web/client?auth=inherit#ratingsdirect/creditResearch?rid=3423086
ix https://www.capitaliq.spglobal.com/web/client?auth=inherit#ratingsdirect/creditResearch?rid=3422568
x https://www.nasbo.org/reports-data/fiscal-survey-of-states
xi https://www.moodys.com/research/US-Public-Finance-US-municipal-bond-default-and-recovery-rates-1970-2024-Default-Report–PBM_1445155
xii Internal and Moody’s. https://www.moodys.com/research/US-Public-Finance-US-municipal-bond-default-and-recovery-rates-1970-2024-Default-Report–PBM_1445155