At the midpoint of 2025, the gap between market optimism and macroeconomic fragility has become more evident. On the surface, the first half of the year showed gains across most major equity indices, driven by AI-powered enthusiasm, resilient consumer spending, and expectations of accommodative central bank policies. However, beneath the surface, the underlying currents are changing.
The second quarter showed signs of economic slowdown, ongoing cost pressures, and renewed policy uncertainty. While headline inflation eased, consumer inflation expectations jumped. Labor markets remained stable but showed early signs of stress. Additionally, geopolitics re-entered the economic conversation through tariffs, trade reshuffling, and fiscal strategies. For investors, the first half of 2025 was more than just experiencing a market rally; it was a test of interpretation. Were these gains a sign of real recovery, or a temporary pause before structural risks reemerge?
This report reviews the macroeconomic developments, asset class performance, and emerging themes that influenced the first half of the year. It also provides insight into forces we believe are likely to shape capital markets through the end of the year and beyond.
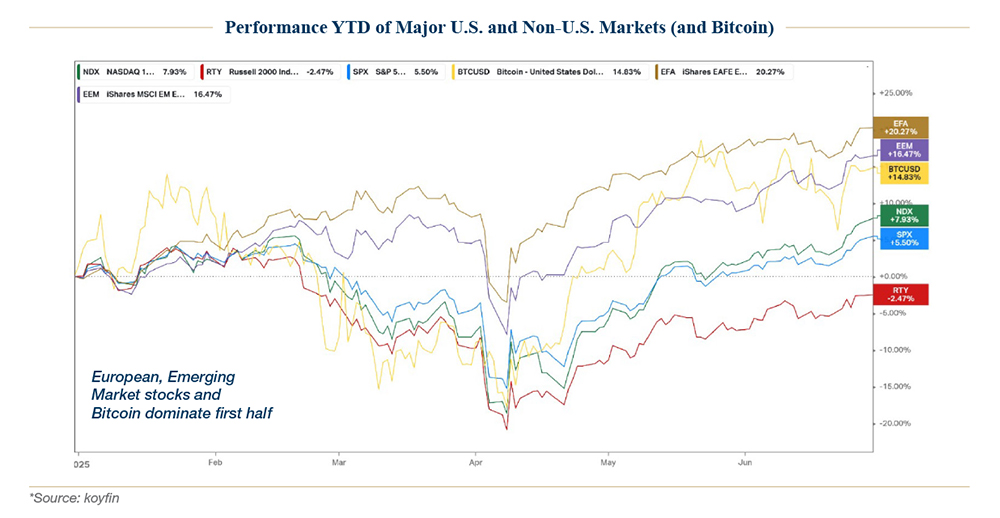
Source: koyfin
Market Performance Overview
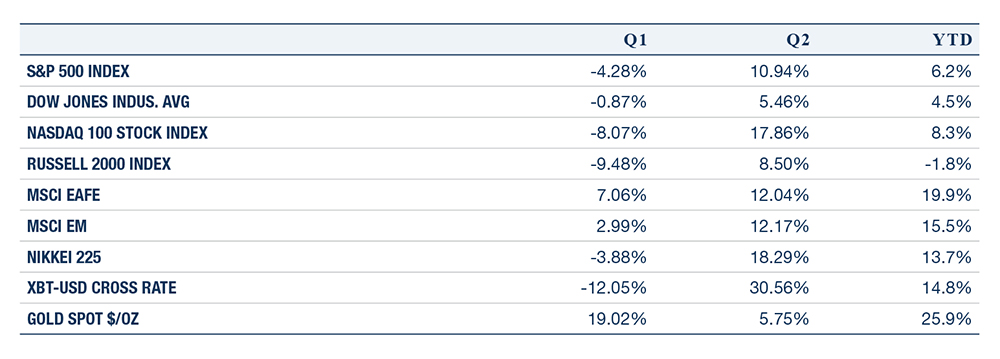
- The S&P 500 10.94% in Q2 and is up 6.2% year-to-date.
- The Nasdaq 100 surged 17.86% for the quarter and 8.3% year-to-date, driven by continued strength in artificial intelligence and large-cap technology.
- The Dow Jones Industrial Average gained 4.5% year-to-date.
- The Russell 2000 rose 8.5% in Q2 but remains down 1.8% year-to-date.
Source: Bloomberg
Beneath the surface, economic growth moderated, inflation expectations shifted, and global risks continued to build.
U.S. Growth and Economic Conditions
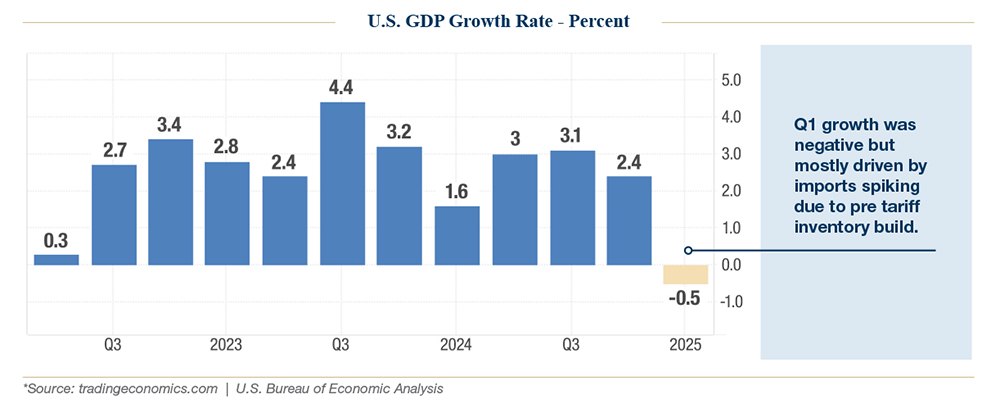
The quarter started with a significant downward revision to U.S. GDP. First-quarter GDP was initially estimated to decrease by 0.2%, but it was later revised to a 0.5% contraction-the first such decline in three years. The drop was mainly due to a 42.6% surge in imports as companies hurried to bring in goods before new tariffs took effect, taking more than three percentage points off GDP.i
Source: tradingeconomics.com | U.S. Bureau of Economic Analysis
While domestic demand remained modestly positive, signs of slowing were evident. The Atlanta Fed’s GDPNow forecast declined from 5.2% in April to 3.8% in June. The Conference Board’s Leading Economic Index fell for the 26th time in 27 months. Industrial production stalled, and purchasing manager indices (PMIs) stayed in contraction territory, especially in manufacturing, where new orders and hiring expectations weakened.ii
Inflation and Fed Outlook
Source: tradingeconomics.com | U.S. Bureau of Labor Statistics
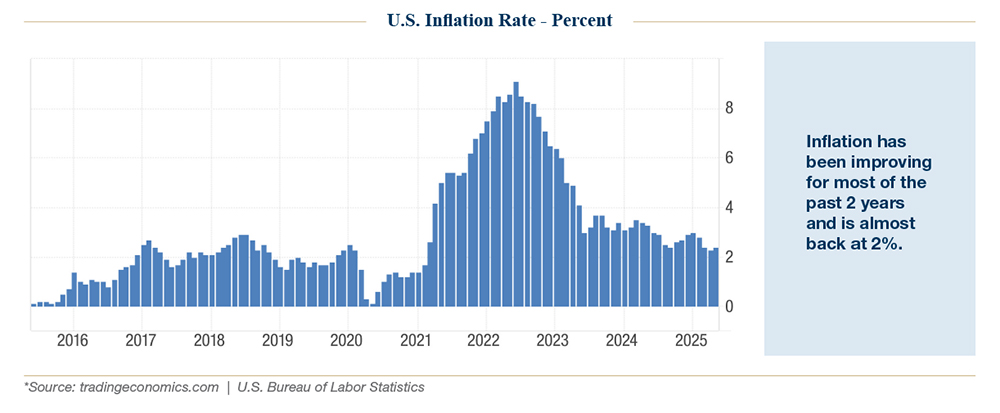
Headline inflation moderated, with the CPI at 2.9% year-over-year and the core PCE at 2.5%, both below consensus forecasts. However, underlying pressures resurfaced. The ISM Services Prices Paid Index rose to 65.1 in April, the highest reading since early 2022.
Wage growth remained firm, with average hourly earnings increasing at a 3.9% annual rate. Most notably, consumer inflation expectations jumped sharply. The University of Michigan’s one-year outlook climbed to 7.3% in May-its highest level since 1981-while the five-year outlook reached 4.6%.iii
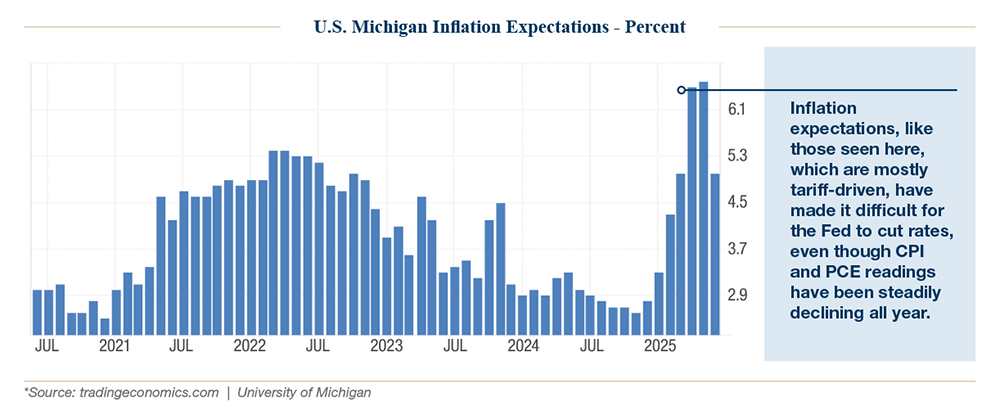
Source: tradingeconomics.com | University of Michigan
This shift has complicated the Federal Reserve’s path forward. At the start of Q2, markets priced in four rate cuts for 2025. By quarter-end, expectations had been reduced to two.
Labor Market Developments
The labor market showed early signs of softening. June nonfarm payrolls rose by 139,000, but prior months were revised down by 95,000. Labor force participation fell to 62.4%, and weekly jobless claims ticked higher.iv
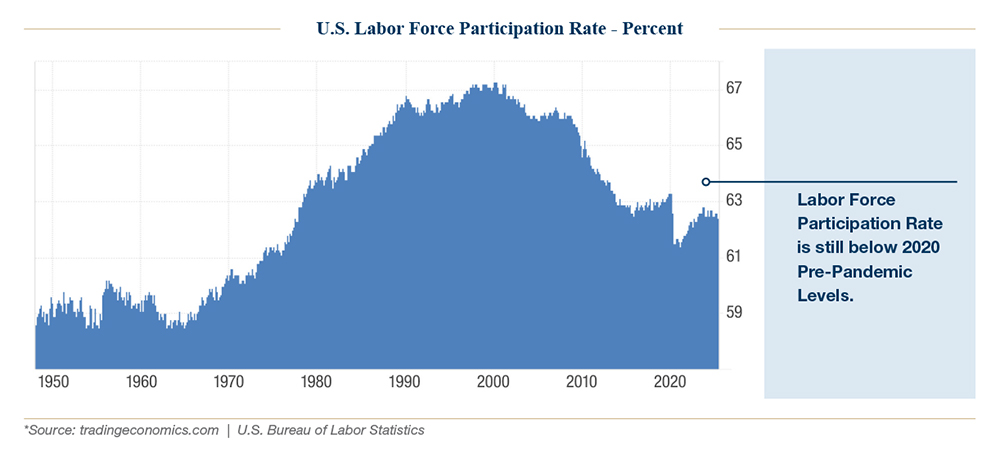
Source: tradingeconomics.com | U.S. Bureau of Labor Statistics
Unit labor costs increased 5.7% in the first quarter, indicating that even amid softer demand, input cost pressures remain. The unemployment rate held steady at 4.2%, but a deceleration trend is emerging.
Policy Developments
Policy volatility was considered a defining theme in the quarter. On April 2, the Trump administration announced sweeping tariffs under Executive Order 14257. A 10% baseline tariff on nearly all U.S. imports took effect April 5, with higher, country-specific tariffs phased in shortly thereafter.
This caused a sharp market selloff in early April, particularly after a series of escalating retaliatory tariffs ensued between the U.S. and its largest trading partner, China, which ultimately culminated in a threatened 145% levy by the U.S., before cooler heads prevailed. By mid-May, a temporary truce with China helped trigger a rebound, but new tariff threats on EU goods and Apple reignited tensions by June. A federal court ruling in early June temporarily blocked the administration’s authority to impose reciprocal tariffs, but that decision was quickly appealed, leaving markets in a legal gray area. Meanwhile, the House passed a $3 trillion tax-and-spending package, which included significant increases in entitlement spending and tax credits. The fiscal response pushed the 30-year Treasury yield above 5.1% and renewed concerns about a potential credit rating downgrade.v
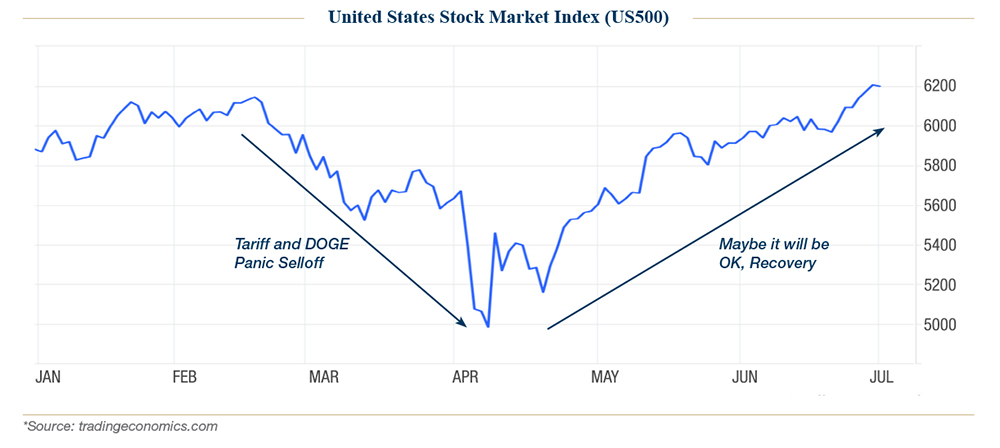
Source: tradingeconomics.com
These policy changes have created renewed uncertainty in global trade flows and corporate supply chains, an area we continue to closely monitor as we evaluate our second-half positioning.
The Shape of What Comes Next
The second half of the year brought not only renewed patriotism in anticipation of the July 4th holiday but also provided a booster shot of renewed political capital for President Trump, as the contested One Big Beautiful Bill (OBBB) was successfully passed by Congress and signed into law on Independence Day. At first glance, the OBBB appears to provide tax cuts of over $260 billion in 2026 with business expensing ($54 billion), expanded SALT deductions ($34 billion), and research expensing (also nearly $34 billion) topping the segments of contributors.
At AMPWP, we believe OBBB offsets the impact of in-place tariffs, which are estimated at $225 billion, and that is before more than half of those were blocked by the courts. The jury is still out on “who” will ultimately bear the cost of the implemented tariffs, but even if U.S. businesses and consumers bore the entirety of the bill, OBBB just put that money right back into their pockets.
Suffice it to say, markets have, for now, absorbed a range of crosscurrents-slowing growth, inflation concern related volatility, and policy surprises-without significant risk repricing. However, this resilience has reduced the margin for error.
At AMPWP, we believe the rest of 2025 will likely bring more tension between the stories markets want to tell and the data policymakers must face. Investors need to stay alert to second-order effects: How will trade policies influence supply chains and profit margins? Will softening labor markets change consumer behavior? How might fiscal policies reshape the investment landscape?
At Alvarez & Marsal Private Wealth Partners, we focus on building portfolios that can structurally withstand the uncertainty we inevitably know will arise, and the first half of 2025 was a masterclass in why this is important. History is replete with examples of risky periods, whether in fact or in headlines, but long-term investors are better suited by owning great businesses that can withstand uncertain waters and avoiding overreacting to short-term narratives.
We remain committed to working to maintain selective exposure to quality equities, high-quality fixed income, and specifically municipal bonds, and alpha-generating strategies where suitable, while remaining alert to downside risks from policy mistakes, geopolitical shocks, and weakening fundamentals.
It has been nice to see many of you this summer in person outside of Florida, where the dog days of summer have certainly set in. For those we haven’t seen in person, we hope you are reading this somewhere in a comfortable climate. For all of you, our valued client families and friends, wherever you may be, we are always at your disposal and just a phone or video call away.
Disclosure
A&M Private Wealth Partners, LLC (“AMPWP”) is an SEC-registered investment adviser. SEC registration does not imply a certain level of skill or training. For additional information on the services AMPWP provides, as well as our fees for such services, please review our Form ADV at adviserinfo.sec.gov, contact us at 300 Banyan Boulevard, 10th Floor, West Palm Beach, FL 33401, or call us at (561) 268-0900.
This piece and its content reflect AMPWP’s views at the time of its writing, and the information presented and AMPWP’s views are for informational purposes only. Such views are subject to change at any time without notice including due to changes in market or economic conditions, and forward-looking statements or forecasts are based on assumptions and may not be realized. Future events and outcomes are inherently uncertain. Statements are subject to risks and uncertainties that could cause actual outcomes to differ. AMPWP has obtained information provided herein from various third-party sources believed to be reliable, however, such information is not guaranteed and is subject to errors, omissions, and changes. No reliance should be placed on the views and information presented when making any investment or liquidation decision. AMPWP is not responsible for the consequences of any decisions or actions taken or not taken as a result of the views and information presented, and AMPWP does not warrant or guarantee the accuracy or completeness of this piece or information presented.
Additional content may be relevant for further context or other insight. Portfolios should also be viewed in the context of the broad market and general economic conditions prevailing during the periods covered by performance and other information. Any references to future returns and/or risk are not promises of the actual return a portfolio may achieve nor do they reflect all risks. Not all investments are suitable for all investors. All investments involve risk of loss, including to principal, and all investors must be prepared to bear such loss. Different securities, strategies, and allocations have different costs and risks, and diversification also does not assure a profit nor protect against a loss. Past performance is not a guarantee of future results. Additionally, changes in investment strategies, contributions, or withdrawals may materially alter results, as may market conditions, other factors including but limited to economic factors, fees, expenses, and events. Nothing herein should be construed as an investment recommendation. AMPWP does not provide legal, accounting, or tax advice, and AMPWP’s services are not intended to act as a substitute for such advice. AMPWP encourages you to seek the counsel of a qualified attorney and/or accountant for legal, accounting, or tax advice.
ii Federal Reserve Bank of Atlanta. Center For Quantitative Economic Research. GDP Now. https://www.atlantafed.org/cqer/research/gdpnow
iii Trading Economics. https://tradingeconomics.com
iv Trading Economics. https://tradingeconomics.com
v The Congressional Budget Office. Budgets & Projections. “CBO Estimates $3 Trillion of Debt from House-Passed OBBBA.” June 4, 2025. https://www.crfb.org/blogs/cbo-estimates-3-trillion-debt-house-passed-obbba
